Regional Real Estate Investment Strategy: Why Sun Belt Markets Are Cooling While Midwest Opportunities Heat Up


Last updated: February 26, 2026
Key Takeaways
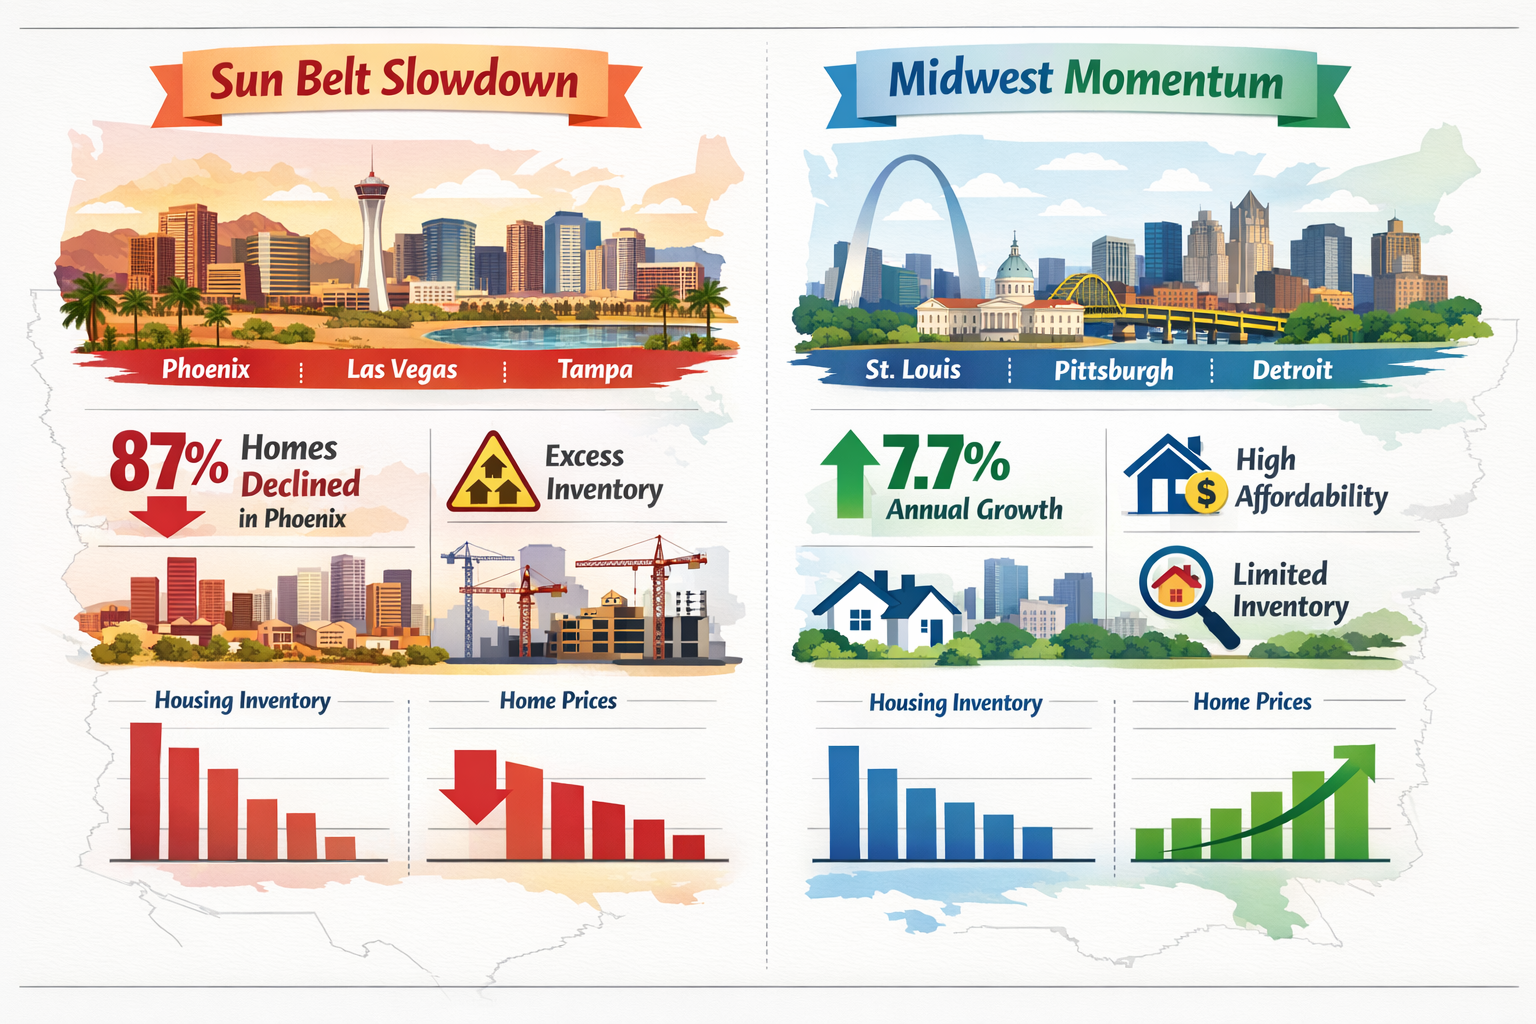
- Sun Belt markets are experiencing price declines due to overbuilding and pandemic-era price corrections, with Phoenix seeing 87% of homes lose value and Las Vegas at 81%[2]
- Midwest markets lead 2026 price growth, with St. Louis up 7.7% annually and five of eight major markets showing 4%+ growth concentrated in the region[8]
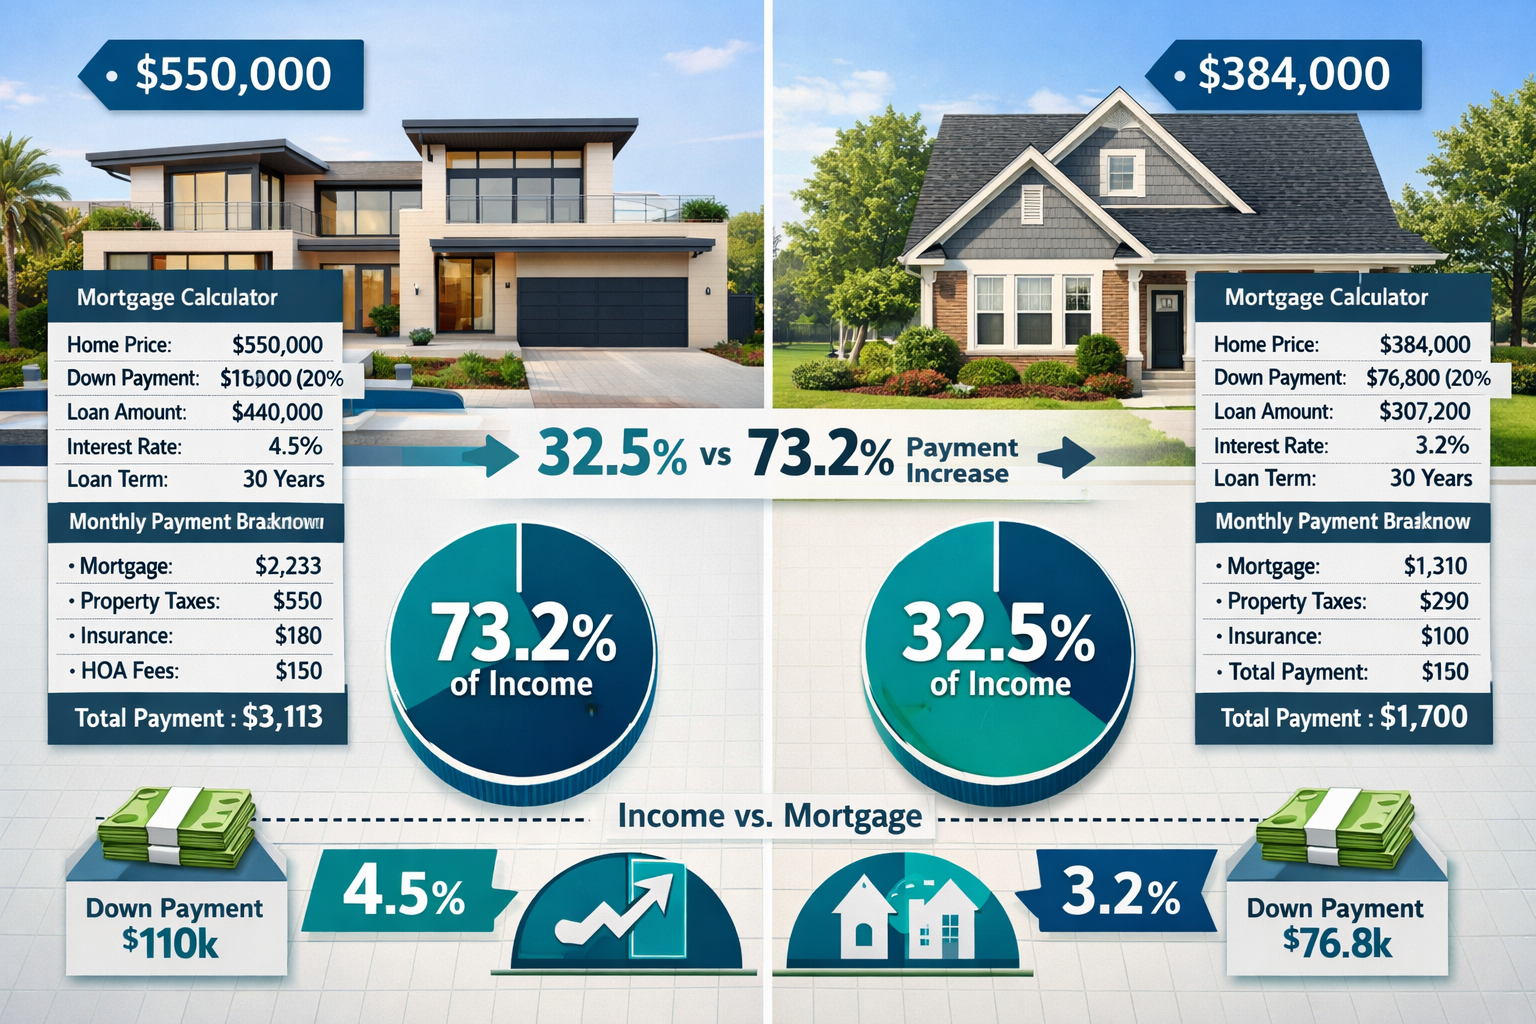
- Affordability drives Midwest advantage, with median list prices at $384,000 versus $415,000 nationally, creating lower barriers to entry[6]
- New construction oversupply pressures Sun Belt resale markets, as builders offer incentives and lower prices to compete with excess inventory[7]
- Transaction volume benefits Midwest investors, where homeowners face 32.5-56.4% payment increases versus 73.2% nationally, encouraging more sales activity[6]
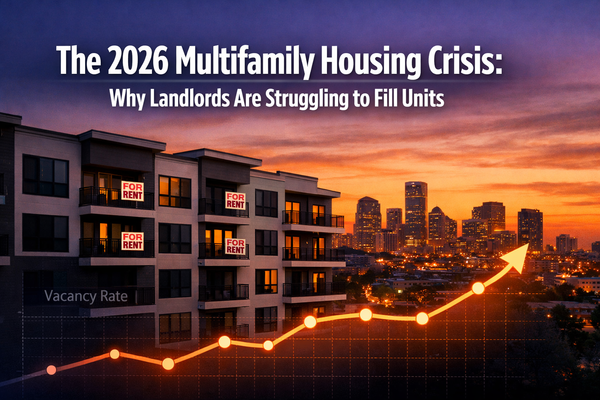
- Apartment fundamentals favor Midwest, with steady rent gains and limited new supply compared to oversupplied Sun Belt regions[3][5]
- Hartford, Rochester, and Worcester lead the nation in combined home sales and price growth for 2026[6]
- Supply constraints persist in top Midwest markets, with inventory remaining 60%+ below pre-pandemic levels despite buyer-friendly conditions[6]
Quick Answer
The regional real estate investment strategy landscape has shifted dramatically in 2026. Sun Belt markets like Phoenix, Austin, and Tampa are cooling after unsustainable pandemic-era price run-ups, facing oversupply from excessive new construction and declining home values. Meanwhile, Midwest markets including St. Louis, Pittsburgh, and Rochester are heating up with annual price growth exceeding 4-7%, lower entry costs, and stronger fundamentals. Investors are pivoting from overheated Southern and Western markets to affordable Midwest opportunities with better appreciation potential and transaction volume.
What's Driving the Sun Belt Market Slowdown in 2026?
Sun Belt markets are experiencing widespread price declines concentrated in the Gulf Coast and Mountain West, with many areas seeing flat or declining prices as of January 2026[7]. The slowdown stems from three primary factors that converged after years of explosive growth.
Overbuilding and excess inventory have created significant downward pressure on prices. An abundance of new home supply has forced builders to lower prices and offer affordability incentives, pushing buyers toward new construction with better deals and increasing pressure on the resale market[7]. This oversupply is particularly acute in markets that attracted heavy developer investment during the pandemic boom.
Unsustainable pandemic-era valuations are correcting. Sun Belt markets experienced steeper price run-ups than the Midwest during 2020-2021, with home price growth outpacing local income levels[7]. As pandemic-driven domestic migration slowed and mortgage rates rose in 2022, markets like Tampa and Austin faced challenges supporting inflated prices.
Specific market declines include:
- Phoenix: 87% of homes declined in value over the past year[2]
- Las Vegas: 81% of homes lost value[2]
- Denver: 91% of homes experienced price declines[2]
Job growth deceleration compounds the problem. Previously dominant employment leaders like Las Vegas are expected to see much slower growth in 2026, with parts of the Midwest and Northeast seeing renewed momentum instead[2].
Common mistake: Investors often assume Sun Belt markets will automatically rebound because of warm weather and historical migration patterns. However, structural oversupply and affordability barriers can create extended correction periods that differ significantly from temporary market dips.
Why Are Midwest Markets Outperforming in the Current Investment Cycle?
Midwest markets are leading national price appreciation in 2026 because they avoided the steepest pandemic-era price increases, maintaining relative affordability while Sun Belt markets became overextended[4]. This created more attractive entry points for both homebuyers and investors.
Price growth leadership is concentrated in the Midwest. Five of eight major U.S. markets with more than 4% annual price growth in December 2025 were located in the Midwest[8]:
| Market | Annual Price Growth (Dec 2025) |
|---|---|
| St. Louis | 7.7% |
| Pittsburgh | 4%+ |
| Cincinnati | 4%+ |
| Detroit | 4%+ |
| Chicago | 4%+ |
Affordability advantages drive demand. The median list price across the top 10 refuge markets is $384,000, significantly below the national median of $415,000[6]. Specific markets offer even better value:
- Rochester: ~$140,000[2]
- Harrisburg: ~$152,000[2]
- Granite City: ~$119,000[2]
- Birmingham: ~$149,000[2]
Lower mortgage lock-in effects boost transaction volume. In affordable markets like Rochester and Toledo, homeowners moving to a new property face payment increases between 32.5% and 56.4%, compared to a daunting 73.2% nationally[6]. This encourages higher sales activity, creating more opportunities for investors to acquire properties.
Choose Midwest markets if: You're seeking steady appreciation with lower capital requirements, want markets with improving fundamentals rather than correction risk, or need transaction volume to support fix-and-flip or wholesale strategies.
How Does the Regional Real Estate Investment Strategy Differ Between Sun Belt and Midwest Markets?
A successful regional real estate investment strategy in 2026 requires fundamentally different approaches for Sun Belt versus Midwest markets based on their divergent fundamentals and risk profiles.
Sun Belt strategy considerations:
- Wait for bottom signals before deploying capital, as price declines may continue through 2026
- Focus on distressed opportunities where sellers face pressure from oversupply
- Avoid new construction competition zones where builders offer incentives that undercut resale values
- Target established neighborhoods with limited new development rather than expanding suburban areas
- Build in longer hold periods to weather potential extended corrections
Midwest strategy advantages:
- Enter growth markets early while prices remain below national averages
- Capitalize on appreciation momentum in markets showing 4-7% annual gains
- Benefit from transaction volume created by lower lock-in effects
- Acquire cash-flowing properties with better cap rates than coastal markets
- Scale portfolios faster due to lower entry costs per property
Apartment market dynamics also favor the Midwest. Midwest apartment markets are outperforming the Sun Belt in 2026, with steady rent gains and limited new supply compared to oversupplied Sun Belt regions[3][5]. This indicates broader demand strength beyond single-family residential.
Edge case: Some Sun Belt submarkets with severe supply constraints or unique economic drivers (major corporate relocations, infrastructure projects) may buck regional trends. Always analyze micro-market fundamentals, not just regional patterns.
Which Specific Midwest Markets Show the Strongest Investment Potential?
Realtor.com's top 10 markets for combined growth in home sales and prices are dominated by Northeast and Midwest cities, providing clear targets for investors shifting their regional real estate investment strategy[6].
Top-tier opportunity markets:
- Hartford, Connecticut - Leading combined sales and price growth
- Rochester, New York - Exceptional affordability (~$140K median) with strong fundamentals
- Worcester, Massachusetts - Price growth with persistent supply constraints
- Toledo, Ohio - Low lock-in effects driving transaction volume
- Providence, Rhode Island - Northeast market with Midwest-like affordability
- Richmond, Virginia - Southern location with Midwest characteristics
- Grand Rapids, Michigan - Strong local economy supporting demand
- Milwaukee, Wisconsin - Major metro with below-national pricing
- New Haven, Connecticut - University-anchored demand
- Pittsburgh, Pennsylvania - 4%+ annual growth with diversified economy
Price appreciation despite affordability makes these markets particularly attractive. While national list prices have remained relatively flat compared to 2022, prices in these refuge metros have surged by an average of 16.3% since that baseline[6].
Supply constraints support continued growth. Inventory in top markets such as Hartford and Worcester remains 60% or more below pre-pandemic levels, meaning supply constraints persist despite the buyer-friendly environment[6].
Affordability metrics show strong fundamentals. Five of Zillow's top ten buyer-friendly markets show affordability where a median household can afford a typical home with mortgage payments costing below 30% of income, assuming a 20% down payment[1].
Decision rule: Prioritize markets combining three factors: (1) current affordability below national median, (2) year-over-year price growth above 4%, and (3) inventory levels below pre-pandemic baselines.
What Are the Key Risk Factors When Shifting Investment Focus to Midwest Markets?
While Midwest markets show strong fundamentals, investors must understand regional characteristics that differ from Sun Belt investing to avoid common pitfalls.
Climate and maintenance considerations impact operating costs. Midwest properties face harsher winters requiring robust HVAC systems, roof maintenance for snow loads, and potential freeze-related plumbing issues. Budget 15-20% higher annual maintenance reserves compared to Sun Belt properties.
Population growth rates remain slower than historical Sun Belt trends. While Midwest markets are gaining momentum, they're not experiencing the explosive migration that drove Sun Belt appreciation in previous decades. Set realistic appreciation expectations of 4-8% annually rather than double-digit growth.
Property condition varies significantly in older housing stock. Many Midwest markets feature housing built in the early-to-mid 20th century, requiring more thorough inspections for foundation issues, outdated electrical systems, and lead paint concerns.
Economic diversification matters. Some Midwest cities remain heavily dependent on specific industries. Research local economic drivers:
- Diversified economies: Chicago, Pittsburgh, Columbus
- University-anchored: Rochester, New Haven, Ann Arbor
- Manufacturing-dependent: Detroit, Toledo, Grand Rapids (higher risk if sector weakens)
Rental demand patterns differ from Sun Belt markets. Midwest renters often prioritize school districts and neighborhood stability over amenities like pools and fitness centers common in Sun Belt developments.
Common mistake: Applying Sun Belt property management approaches to Midwest markets. Tenant expectations, lease terms, and seasonal vacancy patterns require region-specific strategies.
How Should Investors Allocate Capital Between Cooling and Heating Markets?
Strategic portfolio allocation in 2026 requires balancing risk, timeline, and capital availability across different regional opportunities within your real estate investment strategy.
Conservative allocation (lower risk tolerance):
- 70-80% Midwest markets - Focus on proven appreciation leaders like St. Louis, Pittsburgh, Hartford
- 20-30% cash reserves - Wait for clear Sun Belt bottom signals before deploying
- 0-10% selective Sun Belt - Only distressed opportunities with significant equity cushion
Moderate allocation (balanced approach):
- 50-60% Midwest markets - Diversify across 3-4 different metros to reduce concentration risk
- 20-30% Sun Belt value plays - Markets showing stabilization with oversupply clearing
- 20% cash reserves - Maintain dry powder for emerging opportunities
Aggressive allocation (higher risk tolerance, longer timeline):
- 40% Midwest growth markets - Capture current momentum
- 40% Sun Belt distressed - Buy correction bottoms for long-term appreciation
- 20% cash reserves - Deploy opportunistically as market conditions evolve
Rebalancing triggers:
- Shift toward Sun Belt when inventory levels drop below 4 months supply and price declines moderate
- Reduce Midwest exposure if price growth exceeds 10% annually (overheating signals)
- Increase cash if national mortgage rates spike above 8% (demand shock risk)
Timeline considerations: Midwest markets suit investors needing near-term cash flow and steady appreciation (3-7 year holds). Sun Belt opportunities require longer timelines (7-10+ years) to weather corrections and capture recovery appreciation.
What Metrics Should Guide Your Regional Real Estate Investment Strategy in 2026?
Successful regional investing requires monitoring specific indicators that signal when to enter, hold, or exit different markets.
Market health indicators:
Price trends:
- Year-over-year median price change (target: 4-7% growth)
- Percentage of homes selling above list price (strong: >30%, weak: <15%)
- Price per square foot trends (more reliable than median price alone)
Supply metrics:
- Months of inventory (balanced: 4-6 months, buyer's market: >6, seller's: <4)
- New construction permits vs. household formation (oversupply risk: permits >120% of formation)
- Days on market (faster = stronger demand)
Demand signals:
- Job growth rate (target: above national average)
- Population migration (in-migration positive, but not required if natural growth strong)
- Wage growth vs. home price growth (sustainable: wages growing faster)
Affordability measures:
- Median home price to median income ratio (affordable: <3.5x, stretched: >5x)
- Mortgage payment as percentage of median income (healthy: <30%, stressed: >40%)
- Rent vs. buy payment differential (buy advantage supports demand)
Transaction volume:
- Year-over-year sales volume change (growing volume = healthy market)
- Lock-in effect severity (lower payment increases = more transactions)
- First-time buyer percentage (healthy: >30% of transactions)
Apartment market indicators (for multifamily investors):
- Rent growth rate (Midwest target: 3-5% annually)
- Absorption vs. new deliveries (positive absorption = demand exceeds supply)
- Vacancy rates (healthy: 5-7%, oversupplied: >10%)
Where to find data: Local MLS reports, Zillow Research, Realtor.com market trends, CoStar for multifamily, Bureau of Labor Statistics for employment, and Census Bureau for migration.
FAQ

Are Sun Belt markets still good for real estate investment in 2026?
Sun Belt markets face headwinds from oversupply and price corrections in 2026, making them higher-risk compared to Midwest alternatives. However, selective distressed opportunities in strong submarkets may offer long-term value for patient investors willing to weather extended corrections and hold 7-10+ years.
Which Midwest city offers the best real estate investment returns in 2026?
St. Louis leads with 7.7% annual price growth, while Rochester offers exceptional affordability at ~$140,000 median prices[2][8]. The "best" market depends on your strategy: St. Louis for appreciation, Rochester for cash flow and portfolio scaling, Hartford for combined sales and price growth momentum.
How much capital do I need to start investing in Midwest real estate markets?
Entry costs in top Midwest markets range from $119,000 to $384,000 median prices, meaning investors can acquire properties with $24,000-$77,000 down payments (20% down), significantly lower than Sun Belt or coastal markets[2][6]. This allows faster portfolio scaling with limited capital.
Will Sun Belt markets recover, or is this a permanent shift?
Sun Belt markets will likely stabilize once oversupply clears and prices align with local incomes, but recovery timelines remain uncertain and could extend 2-5 years. The shift isn't permanent, but the era of Sun Belt markets consistently outperforming other regions has ended as affordability constraints limit demand.
What makes Midwest markets different from previous investment cycles?
Unlike previous cycles where Midwest markets lagged, 2026 shows these regions leading national price growth because they avoided pandemic-era overvaluation, maintained affordability, and now benefit from buyers priced out of coastal and Sun Belt markets[4][8]. Remote work has also reduced the weather advantage of Sun Belt locations.
How do mortgage rates affect regional real estate investment strategy?
Higher mortgage rates (currently elevated in 2026) amplify affordability differences between regions. Midwest markets with lower price points create smaller monthly payments, reducing rate sensitivity. Sun Belt markets with higher prices face greater demand destruction when rates rise, explaining part of their current weakness.
Should I sell my Sun Belt properties and move to Midwest markets?
Selling during a market downturn often locks in losses. Evaluate each property individually: if cash flow remains positive and you can hold long-term, waiting for recovery may be better. If properties are cash-flow negative or you need capital for better opportunities, strategic exits may make sense despite selling in a weak market.
What are the best property types for Midwest real estate investing?
Single-family homes in established neighborhoods offer appreciation and stable tenant demand. Small multifamily (2-4 units) provides cash flow advantages with lower competition than large apartment buildings. Avoid luxury properties, as Midwest markets favor middle-income housing with broader tenant pools.
How does rental demand compare between Sun Belt and Midwest markets in 2026?
Midwest apartment markets are outperforming Sun Belt regions with steady rent gains and limited new supply, while Sun Belt markets face oversupply pressuring rents[3][5]. Single-family rental demand remains strong in both regions, but Midwest offers better fundamentals currently.
When will it be safe to invest in Sun Belt markets again?
Watch for three signals: (1) inventory dropping below 4 months supply, (2) three consecutive months of year-over-year price increases, and (3) new construction permits declining below household formation rates. These indicate oversupply clearing and demand stabilizing.
Can I use the same property management approach in Midwest and Sun Belt markets?
No. Midwest properties require different maintenance protocols for winter weather, tenant expectations prioritize school districts over amenities, and lease terms often include snow removal and heating provisions absent in Sun Belt markets. Hire local property managers familiar with regional requirements.
What percentage of my real estate portfolio should be in Midwest markets?
Conservative investors should allocate 70-80% to Midwest markets in 2026 given current fundamentals. Moderate risk tolerance supports 50-60% Midwest allocation. Only aggressive investors with long timelines should maintain majority Sun Belt exposure, focusing on distressed opportunities with significant upside potential.
Conclusion
The regional real estate investment strategy landscape has fundamentally shifted in 2026, with Sun Belt markets cooling after years of dominance while Midwest opportunities heat up. Investors who recognize this transition and adjust their strategies accordingly will capture better returns with lower risk than those clinging to outdated assumptions about regional performance.
Sun Belt markets face structural challenges from oversupply, with Phoenix, Las Vegas, and Denver seeing 80-90% of homes declining in value[2]. New construction excess continues pressuring resale markets as builders offer incentives to move inventory[7]. These headwinds will likely persist until oversupply clears and prices realign with local incomes, a process that could take 2-5 years.
Meanwhile, Midwest markets lead national appreciation with St. Louis up 7.7% annually and five of eight top-growth markets concentrated in the region[8]. Affordability advantages, lower lock-in effects, and persistent supply constraints create favorable conditions for both appreciation and cash flow. Markets like Hartford, Rochester, and Toledo combine price growth, transaction volume, and entry costs well below national averages[6].
Actionable next steps:
- Audit your current portfolio - Evaluate Sun Belt holdings for cash flow sustainability and exit timing
- Research specific Midwest markets - Focus on the top 10 markets identified by Realtor.com, analyzing local job growth and inventory levels
- Connect with local professionals - Establish relationships with property managers, contractors, and real estate agents in target Midwest markets before deploying capital
- Start small - Make your first Midwest acquisition to learn regional dynamics before scaling
- Monitor key metrics - Track inventory levels, price trends, and new construction permits in both regions monthly
- Maintain cash reserves - Keep 20-30% of capital available to capitalize on emerging opportunities as markets evolve
The investors who thrive in 2026 and beyond will be those who adapt their regional strategies based on current fundamentals rather than historical patterns. The data clearly shows Midwest markets offer superior risk-adjusted returns in the current cycle, while Sun Belt markets require patience and selective opportunistic approaches.
References
[1] itiger - https://www.itiger.com/news/2606248153
[2] January 2026 Monthly Housing Market Update - https://www.churchillmortgage.com/articles/january-2026-monthly-housing-market-update
[3] Midwest Apartment Demand 2026 - https://www.housingwire.com/articles/midwest-apartment-demand-2026/
[4] Best Markets Home Buyers 2026 35971 - https://www.zillow.com/research/best-markets-home-buyers-2026-35971/
[5] Metro Absorption Gaps - https://www.housingwire.com/articles/metro-absorption-gaps/
[6] Northeast And Midwest Refuge Markets To Lead Housing Growth In 2026 - https://www.scotsmanguide.com/news/northeast-and-midwest-refuge-markets-to-lead-housing-growth-in-2026/
[7] Major Housing Markets With Falling Rising Home Prices February 2026 - https://www.resiclubanalytics.com/p/major-housing-markets-with-falling-rising-home-prices-february-2026
[8] Watch - https://www.youtube.com/watch?v=gEa3A_YkVIo